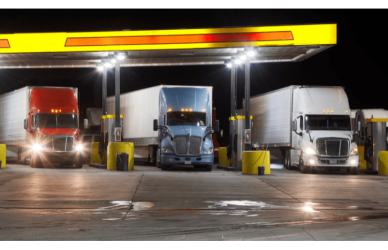
Semi-truck drivers have traversed across the best and worst highway systems in America and the recently released, Reason’s 25th Annual Highway Report, reveals how each state’s roadways rank.
The Reason Foundation’s annual report tracks the performance of the 50 state-owned highway systems and has done so since 1984.
The report measures the performance of state highway systems on cost versus quality. Each state’s overall rating is determined by rankings in 13 categories, including highway expenditures per mile, Interstate and primary road pavement conditions, urbanized area traffic congestion, bridge conditions, and road fatality rates. States with high ratings typically have better-than-average system conditions along with relatively low per-mile expenditures.
The following table shows the overall highway performance of the state highway systems
using 2018 and 2019 data. This report found that the highest-ranking states are North Dakota, Missouri, Kansas, Kentucky, and Idaho. The worst-performing states are New Jersey, Alaska, Delaware, Massachusetts, and Rhode Island.
25th Annual Highway Report Overall Performance and Cost-Effectiveness Rankings
| Overall | State |
|---|---|
| 1 | North Dakota |
| 2 | Missouri |
| 3 | Kansas |
| 4 | Kentucky |
| 5 | Idaho |
| 6 | South Carolina |
| 7 | Tennessee |
| 8 | Mississippi |
| 9 | Arkansas |
| 10 | Montana |
| 11 | South Dakota |
| 12 | Nebraska |
| 13 | Ohio |
| 14 | North Carolina |
| 15 | Minnesota |
| 16 | New Mexico |
| 17 | Utah |
| 18 | Texas |
| 19 | Alabama |
| 20 | Iowa |
| 21 | Virginia |
| 22 | Wisconsin |
| 23 | Arizona |
| 24 | Michigan |
| 25 | Maine |
| 26 | Georgia |
| 27 | Nevada |
| 28 | Oregon |
| 29 | New Hampshire |
| 30 | Vermont |
| 31 | Louisiana |
| 32 | Indiana |
| 33 | West Virginia |
| 34 | Oklahoma |
| 35 | Conneticut |
| 36 | Wyoming |
| 37 | Illinois |
| 38 | Colorado |
| 39 | Pennsylvania |
| 40 | Florida |
| 41 | Maryland |
| 42 | Hawaii |
| 43 | California |
| 44 | New York |
| 45 | Washington |
| 46 | Rhode Island |
| 47 | Massachusettes |
| 48 | Delaware |
| 49 | Alaska |
| 50 | New Jersey |
Between 2016 and 2018, the condition of the overall highway system improved slightly.
Of the performance categories, seven improved based on the compared 2016 and 2018 data. The categories showing national, aggregate improvement include:
- Rural Interstate Pavement Condition
- Urban Interstate Pavement Condition
- Urban Arterial Pavement Condition
- Urbanized Area Congestion
- Structurally Deficient Bridges (a smaller percentage of bridges structurally deficient)
- Overall Fatality Rate
- Rural Fatality Rate
The categories that worsened include:
- Rural Arterial Pavement Condition
- Urban Fatality Rate
Additional Findings:
Rural Interstate Pavement Condition
In 2018, about 1.89% of U.S. rural Interstates—598 miles out of 29,186—were reported to be in poor condition. This is a slight improvement from 2016, the last time the assessment was completed when 566 miles out of 28,820 of rural Interstate pavement was rated poor.
Urban Interstate Pavement Condition
The pavement condition of the urban Interstate system worsened from 2016 to 2018. In 2018, 1,003 of the 19,161 miles of urban Interstates were rated as poor, as compared to 958 poor-condition miles out of 18,505 miles in 2016.
Urbanized Area Congestion
Congestion problems are concentrated in the major cities of the country. The report stated that drivers in 11 states spent more than 50 hours per year in traffic congestion. The most congested states included Delaware, Illinois, and Massachusetts. Each reported commuters spending over 100 hours per year in traffic congestion in 2019.
Structurally Deficient Bridges
The condition of the nation’s highway bridges in 2019 improved slightly from 2018 when the last National Bridge Inventory assessment was completed. Of the 613,517 highway
bridges reported, 46,771 were rated deficient for 2019. This represents a 1.24% improvement from 2018.
Rural Arterial Pavement Condition
Rural Other Principal Arterials (ROPA) are two-to four-lane roadways connecting different
cities or regions. The condition of major rural arterials improved slightly from 2016 to 2018. Overall, 1,068 miles out of 86,926 was reported to be in poor condition.
Urban Arterial Pavement Condition
Urban Other Principal Arterials (UOPA) are four- to eight-lane roadways connecting different parts of an urban region. Overall, there was a slight improvement with 8,985 miles out of 63,903 reported to be in poor condition.
Traffic Fatality
Overall Traffic Fatality
A majority of states, 35 out of 50, reduced their overall traffic fatality rates, Massachusetts, Minnesota and New Jersey reported the overall lowest fatality rates, while South Carolina, Mississippi, Louisiana, and Arizona reported the highest rates.
Rural Traffic Fatality
The nation’s rural highway fatality rate improved from 1.71 in 2016 to 1.36 in 2018. Maryland reported the lowest fatality rate, while Hawaii reported the highest.
Urban Traffic Fatality
The nation’s urban highway fatality rate worsened from 0.77 in 2016 to 0.78 in 2018. Maine reported the lowest fatality rate, while New Mexico reported the highest.


